labradore

"We can't allow things that are inaccurate to stand." — The Word of Our Dan, February 19, 2008.

Tuesday, August 16, 2016

Raising awareness

The new Information Commissioner spots a surge:
"It's my understanding that there's been a substantial increase in the number of requests since 2015," said Molloy.

"One public body that I dealt with last week asked for an extension because amongst other things they said they had more requests this fiscal year than they had in the previous three." 
Molloy has been at the helm of office since July 22, and he said the changes and increased number of access to information requests have made the job more demanding for many in the office.  
"It's a real struggle right now in terms of volume, keeping up with the number of requests."
During the 2014 review of the Access to Information Act designed to undo the unaccountable and undemocratic Bill 29 changes made during the Dunderämmerung in 2012 – changes made to satisfy the intolerance towards access to information shown by Danny Williams –  Commissioner Ring, who never met a Williams-era attempt to restrict access that he couldn't enthusiastically endorse, compiled some statistics in his supplemental submission of August 2014. (See p. 21 of this PDF)

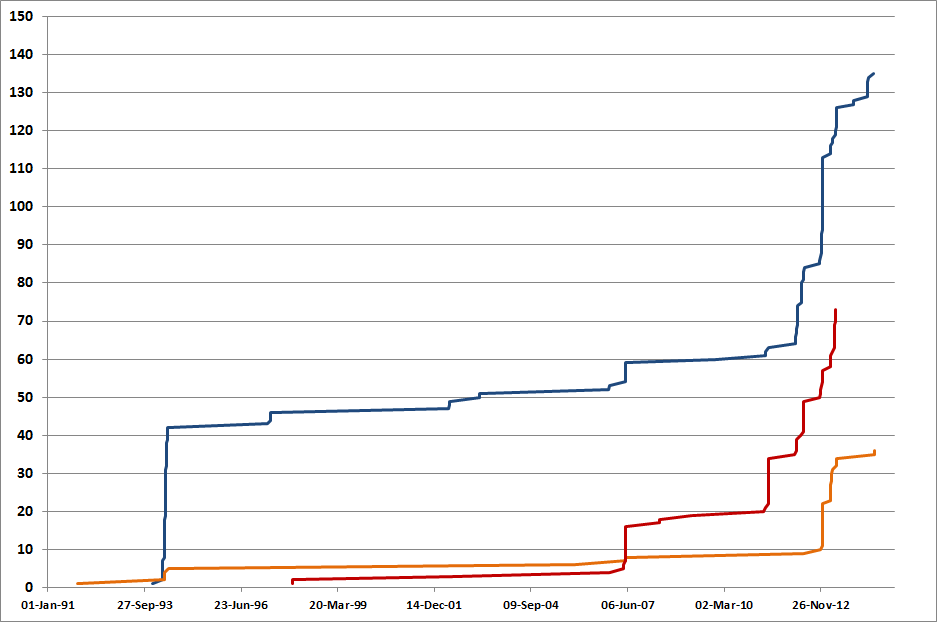
Supplementing these statistics with a quick search of the completed requests database (not quite apples:apples, but close enough), and graphing the result, one can’t help but spot less of a “surge”, and more of a return to business as usual.


Between fiscal years 2008-09 and 2012-13, there was a slow but steady increase in the number of ATI requests being made, averaging about 535 per year until 2012-13, when there truly was a mini-“surge” to nearly 700 requests.

That “surge” during that period could well have been in response to Bill 29, which came into effect part way through that fiscal year, as frequent users of the Act tried to cram their pre-Bill 29 requests in “under the wire”: Bill 29 had a transitional clause which provided that requests received before a certain date would be processed under the law as it existed before the Danny-Dunderdale Tories gutted it.

(Many departments and agencies cleverly short-circuited the transitional provision by simply refusing to open mail addressed to their ATI co-ordinator until the day after Bill 29 received Royal Assent.)

Did Bill 29 have the Danny-Dunderdale desired effect of suppressing ATI activity? You betcha. For the first two full fiscal years that Bill 29 was in force, ATI request volumes dropped to nearly half their pre-29 levels.

Mission accomplished!

After the Wells commission reported, the Davis government, tail between its legs from having been beaten up on the issue for three years, passed the new Act recommended in that report. A few months into fiscal year 2015-16, the new, de-Bill-29’d version of the Act received Royal Assent.

Lo and behold, request volumes returned to their pre-29 levels.

So far this fiscal year, 343 ATI requests have been completed. Projecting forward, and assuming that the pace of request-completion stays constant throughout the year, that works out to 800-and-some requests completed for the year, which would be something of a surge compared to Bill 29 levels, and even, to a lesser degree, compared to pre-29 levels.*

But, apart from a hypothetical surge during the balance of the fiscal year, the statistics do not support the Commissioner’s concerns. On the contrary, they show that the Bill 29 “reforms”, meant as they were to suppress the public’s access to government records, worked, and worked well. To the extent that there has been a surge in request volume since the 2015 unravelling of Bill 29, that may just as easily be accounted for by the fact that, in the post-Bill-29 era, the public is simply more aware of their right to access public records, and, thanks to the elimination of application fees and the praiseworthy creation of an online filing system, more able to exercise that right.

That, in a deliciously perverse way, might be the best legacy of the process, kick-started by Danny Williams in 2009 and dutifully completed by his successors, that was intended to gut that access and deny such accountability in the first place.


* The projected figure for the rest of this fiscal year is "ghosted" in the graph above.

Labels: , ,

Tuesday, April 19, 2016

On free votes

(Private to Sandy Collins.)

Herewith, a cleverly colour-coded table showing how each MHA voted in each final budget vote of the PC era, 2004 to 2015 inclusive. (Click to embiggen.)


Incredibly, in seven of those twelve years, the budget was adopted on a voice vote only, three members having failed to force a recorded division. Those voice votes are indicated in pale yellow.

To repeat: in seven of the twelve Danny Williams, Kathy Dunderdale, Tom Marshall and Paul Davis years, the multi-billion-dollar provincial budget was adopted without a recorded vote.

In the other five years, unsurprisingly, the recorded vote broke down entirely along party lines. PC MHAs present for the vote, voted yea. Opposition MHAs voted nay. Blanks indicate either that the member was absent, or was the Speaker or acting as Speaker for that vote. An asterisk draws your attention to the fact that that member was present for the vote, but in a different caucus, having changed affiliation.

Labels: ,

Friday, January 29, 2016

Danny's Legacy (II)

From the Public Accounts, 2001-2015, passim, a chart of an abstract of the provincial debt and other liabilities, by category, as per yesterday evening's chart, but with the addition of contractual obligations. Values are in $-billion.
 
 
Contractual Obligations are described thusly in Note 11 to the Public Accounts:


Labels:

Thursday, January 28, 2016

Danny's Legacy

From the Public Accounts, 2001-2015, passim, a chart of an abstract of the provincial debt and other liabilities, by category. Values are in $-billion.

Labels:

Thursday, December 03, 2015

That word does not mean what you think it means

Per Wikipedia:
Neoliberalism is a term whose usage and definition have changed over time. Since the 1980s, the term has been used by scholars in a wide variety of social sciences and critics primarily in reference to the resurgence of 19th century ideas associated with laissez-faire economic liberalism. Beginning in the 1970s and 1980s, its advocates supported extensive economic liberalization policies such as privatization, fiscal austerity, deregulation, free trade, and reductions in government spending in order to enhance the role of the private sector in the economy.


During Danny Williams-Government's "austere" tenure as Premier, provincial program spending was reduced upwards by nearly 80%.

[Data source: Fiscal Reference Tables, Finance Canada]

He shrank public-sector employment by increasing it over 10,000 in raw numbers...


... until it upwardly diminished to an unprecedented 30% share of the total workforce (axes do not cross at zero).

 
[Data source: CANSIM table 282-0011]

And as for the role of the private sector in the economy? Nalcor, or its wholly-owned subsidiary, the Danny Williams-Government, acquired or expropriated previously privately-owned hydro-electric assets in Labrador an in central Newfoundland, and actively showed the door to private-sector investors.

In what parallel universe did Danny Williams, effectively the first old-school NDP Premier in Atlantic Canada, qualify as a "neo-liberal" in any possible sense of that term?

Labels:

Tuesday, November 17, 2015

Personalismo


[Edited to correct the second chart.]

Labels: ,

Tuesday, August 04, 2015

Prolixity and verbosity

By popular demand*, here is a rank-size chart showing the number of words spoken by each identifiable ordinary Hon. Member during the life of the 47th legislature.

"Identifiable" means that utterances by "An Hon. Member" and "Some Hon. Members" are excluded. "ordinary" means that the words spoken by the chair occupant — Speaker or Chair of Committee of the Whole — are also excluded. And "Hon. Member" means that words spoken by others, such as the Clerk, Sergeant at Arms, or "strangers", are also excluded.

Each member's record is represented by a vertical column, cleverly colour-coded along traditional lines, reflecting the current political affiliation of that member. Pale colours indicate an MHA who was not in office for the entire duration of the Legislature; i.e., the seven members who resigned and the seven who were elected in the subsequent by-elections. (This does not apply to Kevin O'Brien, late of Gander, who resigned after the House had already risen for the summer.) The darkest blue colour is reserved to represent the words spoken by three PC MHAs as Premier. (Click to enlarge).


Members who resigned their seat (RS) and who were elected in by-elections (BE) are noted, as are the two members who have served as Speaker (Sp), whose word-count as ordinary members would necessarily be depressed by virtue of having held that office.

The winner, and it's not a huge surprise, is the Hon. Member for Burgeo–La Poile. And, again no surprise, the high end of the chart is dominated by opposition members, who have fewer members than the governemtn among whom to divide the daily back-and-forth of debate.

A few government backbenchers really phoned it in. And one also can't help but feel it would have been nice to have heard more from Mr. Pollard.


* One person asked.

Labels: ,

Monday, May 04, 2015

Investor profile

The percentage of .gov.nl.ca press releases which contain the words "invest(ment/s/ed/ing)" in the title, in the context of an announcement of government spending, 1996 to 2015 year-to-date.

Labels:

Friday, January 30, 2015

Cabinet government

The Williams Dunderdale Marshall Coleman Marshall Davis Government released a rather self-serving report on its first 120 days in office this evening.

Apart from Premier Davis himself, the report mentions three other cabinet ministers by name:
  • Steve Kent
  • Tony Cornect
  • Ross Wiseman
  • Judy Manning

Steve Kent, who ran for the PC leadership himself last year, and who totally didn't have a sooper-sekrit leadership pact with Paul Davis, but who threw his support to Davis after being eliminated, garnered five mentions.

Tony Cornect received two, and Ross Wiseman, one.

Judy Manning, who has yet to set foot in the House of Assembly as a Member of that august body, also received one.

No other cabinet minister, elected or otherwise, merited a mention.

Maybe someone with a fresher memory will recall who Messrs. Cornect and Wiseman, and Ms. Manning, supported during the PC leadership race.

Labels: ,

Monday, January 26, 2015

Private to John Riche

Cumulative number of times Wade Locke's name has been invoked in the House of Assembly, by caucus.


Labels: ,

Friday, January 23, 2015

There. They fixed it.

The left-hand column represents the $916-million deficit projected in the December financial update, which bore the deliciously orwellian headline "Responsible Decisions Secure Long-Term Prosperity".

The column on the right represents $2-million — the estimated cost-savings from the bold reform of cutting eight members from the House of Assembly.

What? You don't see a right hand column?

Click to enlarge.


Labels:

Saturday, November 29, 2014

Mr Speaker, Mr Speaker. Mr Speaker.

Mr. Speaker, the Tellitorialists the other day, Mr. Speaker, made some hay, Mr. Speaker, not only, Mr. Speaker, out of the Bow-Wow Parliamentarians' overuse of the phrase "Mr. Speaker", Mr. Speaker, but also, Mr. Speaker, of the Hansard editors' application of the editorial pen, Mr. Speaker, in mercifully protecting future readers, Mr. Speaker, of having to put up with repetitive, Mr. Speaker, and redundant, Mr. Speaker, addressing of remarks through Mr. Speaker, Mr. Speaker:
Jeers: to an inaccurate public record. It behooves us, Mr. Speaker, to point out, Mr. Speaker, that the official record, Mr. Speaker, also known as Hansard, Mr. Speaker, seems to be inaccurate, Mr. Speaker. Specifically, the House of Assembly transcripts are missing several utterances of “Mr. Speaker.” The annoying habit of some members has been glossed over by whoever is writing things down. In a series of answers by Services NL Minister Tony Cornect last week, seven utterances of the term became one in Hansard, then seven became one again, then nine became two, then five became three. If you read the record, you would think the minister only occasionally uttered the term, rather than repeating it ad nauseum. Some shorthand is understandable, such as non-recognized members saying the generic “Hear! Hear!” But this practice leaves a false impression about what was said — or, more accurately, how it was said.
So that got a body wondering: is the Bow-Wow Parliament, as many observers sense anecodotally, getting misterspeakerier?

Mr. Speaker, the answer, Mr. Speaker, is yes, Mr. Speaker.

For the purposes of this exercise, misterspeakeriness is measured in the number of instances of "Mr. Speaker", as well as "Mr. Chair/Madam Speaker/Madam Chair", uttered in debate of the House, including when it is resolved into Committee of the Whole, by identified ordinary Members, expressed as a share of total words spoken. "Identified ordinary Members" means that the words of the presiding officer are excluded, as are those of unidentified Members ("Some Hon. Members" or "An Hon. Member"), and those uttered by non-Members, such as the Clerk, the Lieutenant-Governor, or guests.

This chart shows the misterspeakeriness of debate, as recorded in Hansard, in each session of the House of Assembly since Hansard records begin in HTML format.


Subject to possibly changing editorial tastes by the magical gnomes who produce Hansard, there was a pronounced uptick in misterspeakeriness in recent years, though, whether in the real world or due to editorial fashion, it has fallen off somewhat. The increase in misterspeakeriness would appear to be largely driven by an increase on the government benches:


This would tend to confirm the conspiracy-minded belief that increasing misterspeakeriness is a way of diminishing the amount of meaningful, and potentially embarrassing content that comes out of government members' mouths, especially during Question Period. (Some wags have suggested a similar trend is at work in the House of Commons.)

By contrast, here is the trend for the combined opposition side:

 
By party caucus, here are comparative figures for the Tories:
 
 
The Liberals:
 
 
And the NDP:


(Private to all Members: you only need to address yourself to the Speaker once, off the top.)

Labels: , ,

Wednesday, November 26, 2014

Valid points

Some Tiny Tories had an interesting exchange with CBC legislative reporter David Cochrane as last night's by-election results rolled in:


Here are some more valid points:

Not only did Liberal Crocker get more votes in Trinity–Bay de Verde than Tory Johnson did in 2011, he had one of the highest raw vote-tallies of any Liberal since this historically "swing" district was created in the redistribution of 1975:

 
In percentage terms, Crocker had the largest vote-share of any Liberal candidate in the district ever; it was larger than two of Johnson's three personal majorities; and was second only to her blowout in the 2007 Tory landslide.
 

Pretty valid points.

Labels: ,

Friday, September 05, 2014

The slow-motion election

This chart outlines the changes in the composition of the House of Assembly since the October 11, 2011 provincial general election. (Click to enlarge.)


Each "jump" represents a change. Chronologically, from left to right, they are:
  1. September 13, 2012: Tom Osborne leaves the PC caucus.
  2. April 8, 2013: Yvonne Jones resigns (Cartwright–L’anse au Clair).
  3. June 25, 2013: Lisa Dempster wins by-election.
  4. August 29, 2013: Tom Osborne joins the Liberal caucus.
  5. October 2, 2013: Jerome Kennedy resigns (Carbonear–Harbour Grace).
  6. October 29, 2013: Chris Mitchelmore and Dale Kirby leave the NDP caucus.
  7. November 26, 2013: Sam Slade wins by-election.
  8. January 20, 2014: Paul Lane crosses the floor to the Liberal caucus.
  9. February 4, 2014: Chris Mitchelmore and Dale Kirby join the Liberal caucus.
  10. February 28, 2014: Kathy Dunderdale resigns (Virginia Waters).
  11. May 5, 2014: Cathy Bennett wins by-election.
  12. June 2, 2014: Joan Shea resigns (St. George’s–Stephenville East).
  13. August 26, 2014: Scott Reid wins by-election.
  14. September 5, 2014: Charlene Johnson resigns (Trinity–Bay de Verde).
  15. September ??, 2014: Terry French to resign (Conception Bay South).
Missing from image: Tom Marshall's resignation (Humber East).

Labels: ,

Sunday, August 31, 2014

Comparative contests


If you are still wondering why Progressive Conservative members and prominent operatives, having spent the latter half of 2013 ridiculing the provincial Liberals' leadership process, are now rushing to adopt it — for the 2016 leadership race — wonder no longer.

This map expresses the turnout at the PC leadership delegate selection meetings (DSM) held over the summer as a percentage of the total vote in the Liberals' "virtual" leadership vote in each district. (Click to enlarge.)

In only three districts — Kilbride, Lewisporte, and Lake Melville — did the PC leadership turnout exceed half that of the Liberal leadership vote. In twenty-six districts, more than half the province, the PC leadership turnout was 15% or less that of the Liberal leadership turnout in the same district. This "enthusiasm gap" is especially pronounced outside metro St. John's and "around the [Conception] Bay". However, in both Tory-held districts where the sitting MHA is a leadership candidate — Paul Davis' Topsail and Steve Kent's Mount Pearl North — the PC leadership turnout was less than 10% that of the Liberal vote last year.

The low turnout in Davis and Kent's back yards may be attributable, in part, to the fact that they were among the first districts to hold DSMs. The other metro-area district with particularly poor turnout, St. John's Centre, also held its DSM during the first week of meetings.

There is some evidence that either enthusiasm among PC supporters, or ability of the camps to get their supporters out to the bingo halls, or both, increased, if modestly, as the campaign went on. This is what happens when you sort the DSMs chronologically, and group them by week (starting on Mondays) of the campaign period. Where multiple PC district associations held their DSMs on the same day, the districts are sub-sorted alphabetically. Again, the PC leadership turnout is expressed as a percentage of the comparable figure for the 2013 Liberal leadership contest. (Click to enlarge.)


And here's the PC turnout expressed as a percentage of all eligible voters in the district (per the 2011 election return), which yields a clearer upward trend as the campaign progressed:

Expressed this way, the highest PC leadership turnout was in Lake Melville, at 3.4%.

The lowest turnout in last year's Liberal leadership? Lewisporte. 4.0%.

H/T to @TelegramJames for compiling the PC DSM statistics:


Labels: , ,

Wednesday, July 09, 2014

Private to Lynn Hammond

For the benefit of Lynn Hammond, here's a chart showing the relative change in the size of the provincial public sector (sum of direct civil service, health care system, and education system employment; crown corporations not included), and change in the provincial population, 2002-2014.

Figures are an annualized 12-month (employment) or 4-quarter (population) average, indexed to 2002 = 100.

 
Not only did the rapid rate of growth in the provincial public sector under the "Conservative" government outstrip a very modest rebound in population, it actually preceded it.

Labels: ,

Monday, March 31, 2014

Yikes

Per the Newfoundland and Labrador budgetary estimates, 1994-2014 passim, here's the total public-sector debt by fiscal year, cleverly colour-coded by party in office at the start of the fiscal exercise. Figures are in $million. Click to enlarge, if you dare.

Labels:

Friday, March 07, 2014

Downward is upward

The PC MHA for Terra Nova is ever so pleased with the latest CRA poll
An uptick in the PC's popular support, within the margin of error of CRA's methodology, and one point less of support than the Abacus poll taken in the immediate aftermath of former Premier Dunderdale's resignation, might be the silver lining that the Tories are looking for. But the trend — the real trend — is not all that rosey.

Here is the four-poll rolling average of published popular opinion surveys over the past four years (click to enlarge):


Maybe the slight uptick in PC fortunes in the past half-year or so means something, and something that will last.

Or maybe it's just the third dead-cat bounce that the party's fortunes have seen since Dear Leader first noticed that his support was starting to soften in 2010.

Labels: ,

Sunday, February 02, 2014

Money Town

An interesting side-note to last fall's municipal election in St. John's, by way of the unusually-hard-to-find municipal campaign finance disclosures, released on January 21st.

In the mayoral race, the winner in votes wasn't the winner in campaign contributions. Incumbent and winner, Dennis O'Keefe, raised less than $60,000. Runner-up Sheilagh O'Leary raked in over $90,000.

The sources of their respective campaign contributions are strikingly different. The St. John's municipal campaign finance rules require disclosures of all contributions from individuals or businesses of over $250. That is, small individual contributions of under $250 fall under the disclosure threshold, though the aggregate amount of such contributions must be disclosed. O'Leary collected more in such small campaign donations than O'Keefe collected from all sources combined. O'Keefe's campaign was financed mostly by larger contributions from businesses and corporations.

This chart breaks down each candidate's donation totals from personal contributions, business/corporate contributions, and small donations that fall under the reporting limit:
Here's the same data, represented as stacked percentages, rather than dollar totals:

And, restricting ourselves to the reportable contributions, over 90% of O'Keefe's reportables came from business donors. O'Leary's reportable contributions were split almost evenly between businesses and donations from named private individuals.

Labels: ,

Tuesday, January 21, 2014

Loquatiousness

With the Second Session of the 47th Legislature all over but the prorogation, here's what the session's Hansard looks like in cleverly colour-coded data form. (Click to enlarge.)


Each column represents an individual MHA's attributed word-count in the House of Assembly official record. Not surprisingly, given the makeup of the respective caucuses, opposition MHAs are the most prolix, as the work of speaking to bills and motions is distributed among fewer members on the opposition side, and more members on the government side. In fact, just over 52% of all attributed words spoken in the House, not including interventions by the Speaker or Chair, the Clerk or Sergeant-at-Arms, or the Speech from the Throne delivered by the Lieutenant-Governor, were spoken by opposition MHAs, whether Liberal, NDP, or Independent.
 
The next tranche of members, in dark blue, are cabinet ministers. Interestingly, for the verbal assault she comes under in Question Period, the Premier's total is nowhere near the top of the pack.
 
Backbench PC MHAs are in pale blue, while the four current "Parliamentary Secretaries", whatever they do, are in middling blue. On the extreme left of the chart are MHAs such as Ray Hunter, whose entire output this session has consisted of one Member's statement, and Charlene Johnson, whose Ministerial duties have at times been covered off by other cabinet colleagues.
 
It would be idle speculation, of course, to imagine that those PC MHAs who are least enamored with the job of being backbench government room-meat, as measured by their participation in House of Assembly proceedings, might form part of the Gang of Eight for which one Paul Lane, late of the governing caucus, is the poster-member.
 
Notes to the chart:
 
(1) Yvonne Jones resigned as Liberal MHA for Cartwright–L'Anse au Clair on April 8, 2013.
 
(2) Tom Osborne, who had been sitting as Independent MHA for St. John's South since September 13, 2013, joined the Liberal caucus on August 29, 2013. He is colour-coded here as a Liberal.
 
(3) Paul Lane, MHA for Mount Pearl South, joined the Liberal caucus on January 20, 2014. As he has not yet taken his seat as a Liberal, he is colour-coded here as a PC backbencher.
 
(4) Lisa Dempster was elected as Liberal MHA for Cartwright–L'Anse au Clair on June 25, 2013, and has thus not been an MHA for the full period covered by the chart.
 
(5) Jerome Kennedy resigned as PC MHA for Carbonear–Harbour Grace on October 2, 2013. His successor, Liberal Sam Slade, has not yet taken his seat in the House of Assembly.
 
(6) and (7)  St. John's North MHA Dale Kirby, and Straits–White Bay North MHA Christopher Mitchelmore, both elected as New Democrats, began sitting as Independents on October 29th, 2013. They are colour-coded here as New Democrats, as they were for most of the period under consideration.

Labels: ,